Figure 1 "Nordhaus DICE model equations"
-by Thomas Bolioli
December 10, 1999
The purpose of this paper is to explore the possible differences between using an assumed path for technological progress in determining economic output and using an equation that attempts to express some of the dynamics between population, economic output and technological progress. The baseline scenario used comes from William Nordhaus' original DICE model (economic section only) while Julian Simon's Technological Progress function is the basis for the endogenous relationship compared for sensitivity and alternate outcome scenarios. A mathematical model was created and run over data from historical time for calibration, which was derived from the DICE model for continuity, and then run to the year 2100. This resulted in significant and sometimes drastic differences in the level of economic output by 2100 compared with predictions from the Nordhaus conclusions showing that more attention needs to be paid to the role of human adaptation in future projections.
In Nordhaus' DICE model for predicting future economic impacts of global warming and the climate problem, he assumes both technology and population continue to increase at a decreasing rate. The rate of technological increase is slightly less than that of the population and both rates are asymptotic, reaching their effective limits after 2100. These assumptions lead to the question, "What would happen to world economic output if the level of technology was not assumed but was explicitly modeled based on a relationship, derived from historical evidence, between population levels and the level of technology?".
The theory chosen to represent this relationship has been proposed by Julian Simon and Gunter Steinmann. The basic idea is that the greater the total population, the greater the level of technological growth. Underlying this is the idea that technology does develop independent of population growth and technology builds upon itself. So even in the case of a static population, there will be some level of technological advancement, albeit slower than in situations of growing population. Aspects of this theory, serving as the basis for Simon's "Theory of Population and Economic Growth", provide for special circumstances, such as where population growth is negative, but were not explored with this model implementation. As well, the finalized theory provides greater bounds on the adoption of technology given time and level of investment. In short, the level of total technology never decreases since this is, in his estimation, illogical as well there are relationships between the relative value of labor costs v. technology costs.
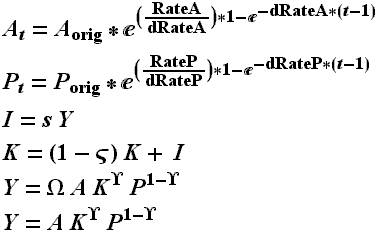
The sensitivity analysis was done by building the Nordhaus economic model, which was based on the Cobb/Douglass constant returns to scale production function and basic economic equations for capital and investment. These equations are represented by Figure 1 below. The definitions and initial values are located in Table 1 "Initial Values and Constants" and Table 2 "Character Definitions" which were for all of the runs which will be discussed in greater detail further into the write-up.
Figure 1 "Nordhaus DICE model equations"
|
Variable |
Nordhaus |
Simon |
Simon |
Simon Modified |
Probable Values |
|
Constants |
|||||
|
dRateA |
0.011 |
N/A |
N/A |
N/A |
N/A |
|
RateA** |
0.015 |
N/A |
N/A |
N/A |
N/A |
|
dRateP/ |
0.0195 |
0.0195 |
0.0195 |
0.0195 |
N/A |
|
RateP/ |
0.0224 |
0.0224 |
0.0224 |
0.0224 |
N/A |
|
b |
N/A |
0.0051221 |
0.0230902 |
0.0109292 |
Optimize |
|
s |
0.268202 |
0.328657 |
0.1 |
0.10781 |
***0.2-0.4 |
|
alpha |
N/A |
N/A |
N/A |
0.638931 |
~0.67-0.75 |
|
beta |
N/A |
N/A |
N/A |
0.281802 |
1-alpha |
|
delta |
N/A |
0.981456 |
0.75 |
0.001 |
~0.5 |
|
epsilon |
N/A |
0.0859601 |
0.009 |
0.0002 |
~0.02-0.04 |
|
mu |
N/A |
0.107298 |
0.4 |
0.396686 |
~0.5 |
|
Upsilon |
0.1 |
0.1 |
0.1 |
0.1 |
N/A |
|
stigma |
0.25 |
N/A |
N/A |
N/A |
N/A |
|
Initial |
|||||
|
K |
16.03 |
16.03 |
16.03 |
16.03 |
N/A |
|
Aorig |
0.00963 |
0.00171177 |
0 |
0.109358 |
Optimize |
|
Porig or |
3369 |
*33.69 |
*33.69 |
*33.69 |
N/A |
|
GDP |
8.519 |
8.519 |
8.519 |
8.519 |
N/A |
|
* Needs to be adjusted for if using the Nordhaus Output Function |
|||||
|
** Actually 10% of Nordhaus 10yr. Values. His per annum values are wrong and yield results lower than his 10yr time step model. |
|||||
|
*** Gross v. Net savings rate |
|||||
Table 1 "Initial Values and Constants"
|
Variable |
|||
|
DrateA |
Second order rate of change for A (decreasing) |
||
|
RateA |
Variable rate of change for A |
||
|
DrateP/dRateL |
Second order rate of change for P (decreasing) |
||
|
RateP/RateL |
Variable rate of change for P |
||
|
B |
Constant |
||
|
s |
Savings Rate |
||
|
alpha |
Constant/Elasticity of base variable |
||
|
beta |
Constant |
||
|
delta |
Elasticity of Technological Progress |
||
|
epsilon |
Elasticity of Output |
||
|
mu |
Elasticity of Labor/Population |
||
|
Upsilon |
Depreciation Rate |
||
|
stigma |
Elasticity of Output |
||
|
1- stigma |
Constant/Share of Labor in Income |
||
|
K |
Capital |
||
|
Aorig |
Technological Progress Factor |
||
|
Porig or Lorig |
Population |
||
|
GDP |
GDP PPP Adjusted 1987 US dollars |
||
Table 2 "Character Definitions"
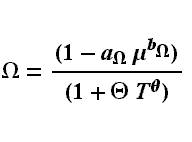
Figure 2 "Nordhaus Damage Function"
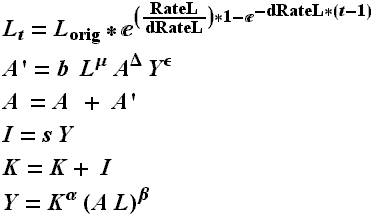
Figure 3 "Simon-Steinmann Equations"
Not that the damage function equation represented by Figure 2 was omitted from this model to eliminate the link between the economic portion of the DICE model and the policy and science portions. This is a factor with values from 0.99986 or less and only runs made without it were used as baseline data. Finally, the Simon-Steinmann model represented by Figure 3 shows the technological progress function (A'). It uses L, A, Y, all raised to their respective coefficients of elasticity and factored by constant b, to determine the change of technology for the period. Note that the function for output (Y) is different from the Nordhaus model and will be discussed later. As well, the equation for capital is not depreciated which is adjusted for by the value for savings rate. Areas to note would be the raising of the product of A and L to the co-efficient for share of labor in income where as in Nordhaus A was simply a factor. This along with the aforementioned created potential in-compatibility's and runs were made using both the Simon and Nordhaus versions for comparison.
The first version of the model included only the Nordhaus equations with his original parameters and was labeled "Nordhaus" (See Table 1 ). Note that for population and technological change 10% of his 10 rates were used instead of his per annum values since they yielded lower numbers than his published data. This was reverse of what should have occurred since the damage function was removed. Depreciation was left as is and was never checked for accuracy. Next the model was modified to include only Simon's (run labeled "Simon" in Table 1 ) function for technological progress (minor units adjustment for population was needed) without changing any other equations. Aside from the unit conversion needed in the size of labor, there was issue with the optimized values for all exponents and the value for b. They were far from the probable range stylized by Simon. The run "Simon 2" (labeled "Simon 2" in Table 1 ) shows what values the optimizer settled on after a few of the better-known parameters were constrained. In most cases a value at the periphery of the constraints was picked signaling the values needed to match historical data were beyond reasonable constraints. Using these values yielded a 0.0 GDP through time. It was determined that the value for A in Nordhaus was markedly different than in the Simon equation. Since the Simon's technological progress equation used A to determine a new value for A' it was determined that the best way to deal with this was to replace the output equation with Simon's version as well. This run was labeled "Simon (mod)" (see Table 1 ) and optimization yielded more "reasonable" results for the initial values. The results for these three runs are shown in Figure 4 GDP (All Variants) . It shows the difference between the two Simon models, not to mention between Nordhaus and the Simon runs. Notice the "Simon" run advances at a much greater rate than either of the other runs. Along with this, it was determined that there was too great of a probability that using the Nordhaus output function was skewing the data so the run labeled "Simon" was removed. This conclusion was backed by the rather distant relationship many of the constants had with their expected values as mentioned earlier for this run. Further comparison was made only between the runs "Nordhaus" and "Simon (mod)" and a new graph of those results are shown in Figure 5 .
Figure 5 "GDP (Projected)"
The results shown in Figure 5 are for the closest possible match to the expected values for each of the constants while remaining calibrated to the historical baseline. Notice in Table 1 "Initial Values and Constants" the values for delta, epsilon and mu are off by significant amounts and the net savings rate is slightly lower than would normally be desired. This fact will be dealt with later but for now lets look at a comparison of the factors of technological progress in Figure 6 . They have been scaled to be roughly proportional (I know, I wasn't able to do the derivation from origin idea we discussed yesterday but I manually checked the first decade for both this and the population/Nordhaus approx. tech. factor and the graph shows the basic idea relatively faithfully.) and shows the difference in growth between Nordhaus' approximation and Simon's. As time goes on, the rate of increase in technology begins to decrease, and the rate of increase in the GDP (Figure 5 ) begins to level off. The Simon model continues to increase as time goes on. This is somewhat deceiving however. One of the further enhancements discussed earlier was a more sophisticated method for limiting the growth of technology and therefore GDP so growth does not occur at too high a rate and without upper bounds. Although the equation used in this model had some governing aspects, the final Simon derivation fills in a few gaps in his original.
Figure 6 "A Factor (Scaled)
One reason for wanting a much more robust technological progress function is the climate problem is not only a result of technology, it has a good chance of being mitigated by technological progress. Underlying the Simon analysis that technology growth is a function of population increase is the idea that there is also a result of increased scarcity of a given resource and the process of building upon past knowledge. Notice in Figure 7 (Simon's equations alone) that GDP continues to grow whether or not population grows. Albeit slower growth but growth none the less. Figure 8 (Simon's equations alone) shows during this same run that the technological progress continued to increase. This is a very logical assumption as he put it. In a drastic and non-mathematical scenario, if a third of the world's population dropped off the face of the earth would people cease to use the technology available to them? They might not need as much oil so some oilrigs would close while other more productive wells would continue to operate. In essence, there would be a scaled back production schedule but what was scaled would probably remain the same. In a more reasonable scenario, if population growth ceased and births matched deaths at replacement levels would people stop inventing. They would most likely slow invention due to the increased availability (reality being the converse, decreased demand) which would allow existing resources to continue farther into time. Eventually however, the available resources will become depleted due to use, therefore spurring invention and, as Simon sees it, increasing the World's GDP. Figure 8 illustrates his interpretation of this and shows the increase of technology outside of an increase in population.
Figure 7 "GDP (Pop Growth v. Static Levels)"
Figure 8 "A Factor (Pop Growth v. Static Levels)"
Regardless of Simon's equations, the lack of endogenous technological progress related to population and other factors significantly weakens the economic portion of the DICE model. As well, expanding this section will allow for greater accuracy in assessing the impact of GHG mitigation on both the LDC and MDC nations.
How this is possible begins with separating the labor force from the population. Inherent in both Nordhaus and this paper's treatment of labor v. total population (Simon's model calls for labor and preliminarily runs better with labor instead of population) is to assess them as congruent in proportion of growth and total size. Looking back on the historical labor force there was a divergent path for the labor force and the total population. From 1965-1995, the total population grew at a faster rate than the labor force. Thinking back to population pyramids and the demographic trend that the LDC's are experiencing demographic changes similar to what the MDC nation experienced post WWII, the divergence is possibly due to the increase of the pre-labor (for arguments sake, less than 20yrs.) population. If one takes the view that all non-labor members of the population are consumers and labor are producers, expanding on the Simon model, for instance would allow you to track both regions separately. It is logical that those in the labor force are net producers since they are able to support the consumption of not only themselves but also, historically at least, two other non-producers. Knowing that the ratio of consumers to producers in the LDC nations is higher than in the MDC nations, it can be assumed that more of the resources and technology being developed in LDC nations are committed to supplying the larger consumer group (fulfilling basic needs as opposed to luxury items). Therefore the MDC nations, knowing that they have a lower consumer to producer ratio have more resources and technology free from filling the basic needs of its net-consumers. Therefore, more resources can be devoted to developing the technology needed to mitigate the GHG emissions. This is especially important if it is supposed that technology needs to be perfected over time and not just developed immediately. Getting the MDC nations developing the technology today, thereby investing more resources will help prime the technology pump for later tapping. Discount rate or not, what is done now will affect the future, if not directly, indirectly by shaping the near future which will affect the distant future.
References
Nordhaus, Managing the Global Commons, 1994;
Simon, Theory of Population and Economic Growth, 1986;
Simon, The Ultimate Resource, 1981;